Introduction
As AI workloads, high-performance computing clusters, and hyperscale deployments push rack densities from historical averages of 5–10 kW to 40 kW and beyond, the power distribution architecture that worked five years ago no longer meets today's demands. Getting the design wrong means costly retrofits, unplanned downtime, and capacity ceilings that stall growth at exactly the wrong moment.
According to the AFCOM 2026 State of the Data Center Report, average rack density has surged to 27 kW per rack, up from 16 kW the previous year—a 69% year-over-year increase. NVIDIA-based GPU server racks now require 132 kW per rack, with next-generation platforms expected to demand 240 kW. At those levels, switchgear ratings, UPS capacity, and cabling infrastructure sized for traditional workloads are already obsolete.
This guide covers:
- The layered power distribution hierarchy from utility entry to rack
- How to engineer scalability and redundancy into the design from the start
- How rising compute density is changing switchgear and cooling decisions
- Compliance standards engineers and facility teams must meet for safe, code-compliant deployments
TLDR:
- Data center power flows through a defined hierarchy: utility entry → transformers → main switchgear → UPS → PDUs → RPPs → racks
- Design for end-state capacity from day one using modular switchgear and pre-planned pathways to avoid costly retrofits
- AI and GPU racks at 40–100+ kW demand three-phase power, higher-rated switchgear, and liquid cooling load planning
- UL 891-certified switchboards meet code requirements for main low-voltage distribution in mission-critical facilities
- Monitor branch circuits and rack-level loads in real time to safely add capacity and prevent downtime
Understanding the Data Center Power Distribution Hierarchy
Scalable power distribution begins with understanding the chain from utility to rack:
Scalable power distribution begins with understanding the full chain from utility to rack:
- Utility service entry
- Medium-voltage switchgear and transformers
- Main low-voltage switchgear and switchboards
- UPS systems
- Power distribution units (PDUs)
- Remote power panels (RPPs)
- Rack-level connections
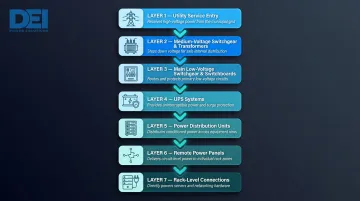
Each layer has a distinct role in isolation, protection, and load management. Designing a resilient, scalable system requires clarity on how these components integrate and where capacity planning decisions carry the most weight.
Utility Entry and Transformer Stage
Utility power is typically delivered at medium voltage—commonly 35 kV—and stepped down via transformers before entering the low-voltage distribution layer. Backup generators integrate at this stage to maintain continuity during grid outages. Proper sizing of this interface is critical: undersized transformers or generator capacity create hard limits that no downstream change can fix.
At this tier, electrical loads are typically split into separate switchboards for mechanical systems (climate control, fire suppression) and networking/mission-critical systems, allowing isolated maintenance and fault containment—limiting the blast radius of any single failure.
Main Low-Voltage Switchgear and Switchboards
This layer receives power from transformers and generators and distributes it to UPS systems and downstream panels. It's where fault isolation, branch circuit protection, and primary load segmentation occur. The switchgear must be rated and configured for the facility's full planned capacity, not just current load.
UL 891 is the Standard for Switchboards, specifically dead-front switchboards—the most common standard in North America. The standard covers dead-front switchboards nominally rated 1000V or less, with U.S. constructions limited to 480V maximum and 4000A maximum current. Dead-front design prevents personnel contact with energized parts, a non-negotiable safety requirement in high-uptime environments.
DEI Power's UL 891-certified low-voltage switchboards are built with genuine Siemens components and manufactured in Ontario, California. For data center projects requiring Buy America Build America compliance, domestically produced equipment at this tier simplifies documentation and speeds inspections.
UPS Layer
From the switchgear layer, power flows into UPS systems—which bridge the gap between utility failure and generator pickup while stabilizing voltage and frequency for sensitive IT equipment. Redundancy is typically built into this tier from the start. UPS sizing must account for both current IT load and planned growth. Distribution system losses—including switchgear, transformers, UPS, and PDUs—can account for 10% to 12% of total energy consumed by the data center, making efficiency a key design consideration.
PDUs, RPPs, and Rack-Level Delivery
PDUs distribute power from UPS systems to server racks. These free-standing cabinets handle the final voltage transformation and provide:
- Metering and status monitoring
- Load profiling across circuits
- Main input circuit breakers and isolation output transformers
- Subfeed breaker systems for individual rack feeds
In larger facilities, RPPs sit between PDUs and server racks as intermediate branch circuit protection points. They act as sub-panels that extend power to specific floor zones, enabling flexible floor layouts and localized maintenance shutdowns without affecting adjacent equipment. At the rack level, balancing load across phases becomes critical for both thermal performance and circuit reliability.
Designing Scalability Into Your Power Infrastructure from Day One
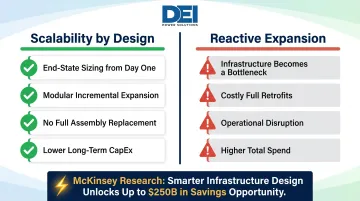
Design for your end-state capacity from the beginning, even if you only deploy a fraction of it initially. That single principle separates facilities that scale smoothly from those that face disruptive, expensive retrofits.
Facilities that over-provision capacity and plan distribution pathways in phases avoid the costly rework that arises when electrical infrastructure becomes the bottleneck — not the IT load.
Scalability by Design Versus Reactive Expansion
Sizing transformers, switchgear, and bus infrastructure for the target end-state capacity — rather than just current needs — means breakers and panels can be partially populated at first, then expanded incrementally without replacing entire assemblies. According to McKinsey & Company, global capital expenditures on data center infrastructure (excluding IT hardware) are expected to exceed $1.7 trillion by 2030, with modular and smarter design approaches potentially reducing this projected spend by up to $250 billion.
Specifying equipment that spans both current deployment and future expansion is where that flexibility is built in. DEI Power's switchboards cover amperage ratings from 400A to 4000A, with configurations supporting multiple voltage options (120/240V, 208Y/120V, 480V, 480Y/277V, 415/240V) and NEMA 1 (indoor) or NEMA 3R (outdoor weather-resistant) enclosures — giving engineers a single product line to specify across phases.
Modular Distribution Approach
Using modular switchgear and PDU architectures allows new capacity to be added in discrete increments—such as adding breaker positions or distribution modules—without deenergizing the entire system. Modular panelboard and switchboard systems enable phased buildouts in hyperscale environments, reducing upfront capital expenditure while keeping future expansion operationally non-disruptive.
Load Planning and Power Headroom as a Design Discipline
Calculate not just peak IT load but also cooling infrastructure loads, lighting, and UPS losses. Per NEC Section 210.20(A), a branch circuit breaker must be rated to handle the noncontinuous load plus 125% of the continuous load. In practice, this means standard (80%-rated) breakers should only be loaded to 80% of their rated capacity under continuous load conditions—a critical constraint in data centers where loads are continuous around the clock.
Including a capacity utilization target—such as operating at no more than 80% of rated capacity—preserves headroom for growth and demand spikes without risking thermal issues or breaker trips.
Busway and Cable Routing Infrastructure
Pre-installed overhead busway systems and dedicated cable pathways make it far easier to add distribution capacity without floor-level rework. Facilities that underplan conduit and cable management often find themselves capacity-constrained by physical routing limitations, not electrical capacity. A practical rule: target no more than 40% cable tray fill at initial buildout, leaving room for additional runs without pulling permits for new pathways.
Planning for Diverse Power Feeds and Future Power Path Additions
Designing for N+1 or 2N distribution from the start eliminates the retrofit cost of adding redundant feeds later. Include stub-outs, spare conduit runs, and pre-positioned switchgear space during initial construction — once the facility is live, operational downtime makes retrofits far more costly. The cost of pre-planning these paths is a fraction of the cost of retrofitting them under time pressure in a live environment.
Redundancy Architectures That Keep the Lights On
Downtime in mission-critical environments carries severe financial consequences. Average cost of downtime is $5,600 per minute, with 40% of enterprises reporting hourly downtime costs of $1M to $5M+. Redundancy architecture is the primary defense against these losses.
Primary Redundancy Tiers
The Uptime Institute Tier Classification System defines four tiers mapped directly to redundancy requirements:
| Tier | Name | Description | Annual Uptime |
|---|---|---|---|
| I | Basic Capacity | Dedicated site infrastructure (UPS, cooling, generator) with no redundancy | 99.671% (28.8 hrs downtime/yr) |
| II | Redundant Capacity | Redundant critical power and cooling components (UPS modules, chillers, generators) | 99.741% (22 hrs downtime/yr) |
| III | Concurrently Maintainable | Redundant delivery path for power and cooling; every component can be maintained without impacting IT operations | 99.982% (1.6 hrs downtime/yr) |
| IV | Fault Tolerant | Individual equipment failures or distribution path interruptions do not impact IT operations; includes all Tier I-III features | 99.995% (26.3 min downtime/yr) |
The appropriate tier is determined by the SLA and workload criticality the facility must support. Most hyperscale and colocation facilities operate at Tier III or Tier IV standards.
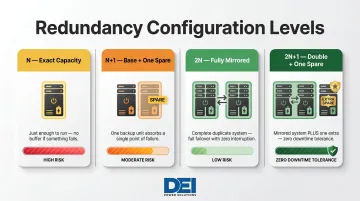
Each tier maps to a redundancy level that defines how much spare capacity is built into the system:
| Level | Configuration | Practical Meaning |
|---|---|---|
| N | Exact capacity for full IT load | No redundancy; any failure impacts operations |
| N+1 | Base capacity + one spare component | Single-component maintenance without downtime |
| 2N | Fully mirrored infrastructure | Complete fault tolerance; one entire path can fail |
| 2N+1 | Double capacity + one additional spare | Zero-downtime tolerance for the most critical workloads |
A/B Power Feed Model at the Rack Level
Tier classification establishes infrastructure-level redundancy — but that protection only extends to the rack if the physical wiring reflects it. Mission-critical servers with dual power supplies should connect to independent power paths (PDU A and PDU B) sourced from separate UPS and distribution branches. This guards against single-path failures and is a baseline design requirement in Tier III and Tier IV environments.
Static Transfer Switches (STS) and Automatic Transfer Switches (ATS)
STS uses semiconductors (thyristors) to switch between two power sources with transfer times measured in milliseconds — virtually instantaneous. This is appropriate for critical loads that cannot tolerate even brief interruptions, such as data centers, banking, and healthcare.
ATS uses mechanical switching to transfer between utility and generator backup power. Transfer times are slower, but that's acceptable for generator switchover scenarios where a brief interruption won't cascade into system failure. Both are UL 1008 listed (STS under UL 1008S). Choosing the right switch type is part of the broader risk calculus — a decision that compounds quickly when redundancy gaps emerge elsewhere in the system.
Operational Risk of Unplanned Redundancy Gaps
Even well-designed redundant systems can become single points of failure through maintenance errors, load imbalances, or equipment that was never commissioned correctly. Commissioning tests and periodic concurrent maintainability testing confirm that redundancy performs under actual failure conditions — not just on paper. A common finding: bypass breakers left in the wrong position or UPS paths cross-connected during installation, leaving what looked like an N+1 system behaving as N under load.
How AI and High-Density Workloads Are Rewriting Power Design Rules
Traditional data center racks averaged 5–10 kW. AI training clusters and GPU-based HPC racks now routinely require 40–80 kW per rack, with some configurations exceeding 100 kW. This density shift forces a complete rethink of upstream switchgear ratings, branch circuit sizing, and distribution architecture.
The Density Shift
Average rack density reached 27 kW per rack in 2026, up from 16 kW the previous year and 6.1 kW in the earliest AFCOM study edition. Historical baseline (1988) was approximately 1 kW per rack. Current and near-term GPU rack power requirements illustrate how fast that trajectory is moving:
- NVIDIA DGX H100 nodes draw 10 kW or more per node; full racks reach 132 kW
- Next-generation platforms are expected to require 240 kW per rack
- NVIDIA Rubin Ultra NVL576 is projected to approach 600 kW per rack (expected H2 2027)
Traditional airflow cooling strategies struggle once racks exceed 40–50 kW, which means the shift to liquid cooling and the shift in distribution design are happening simultaneously.
Impact on Upstream Power Distribution Design
Higher per-rack loads require:
- Larger branch circuits with higher ampacity
- Higher-rated PDUs and switchgear capable of handling concentrated loads
- Three-phase distribution at the rack level — required at these load levels
- Bus ratings and switchboard configurations that traditional enterprise data center designs never anticipated
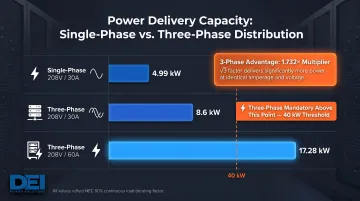
A three-phase power whip delivers 1.732 times more power than a single-phase whip of the same amperage. Derated capacities (per NEC 80% continuous load rule): single-phase 208V/30A = 4.99 kW; three-phase 208V/30A = 8.6 kW; three-phase 208V/60A = 17.28 kW. For racks exceeding 40 kW, three-phase 208V or 400V distribution becomes mandatory.
Phase balancing is critical in three-phase Wye configurations; unbalanced loads cause current flow through the neutral, leading to heating and reduced efficiency.
The Cooling-Power Design Intersection
High-density racks generate more heat, requiring liquid cooling infrastructure—direct-to-chip, rear-door heat exchangers, or immersion cooling—that itself adds electrical load. 36% of data center operators have implemented liquid cooling, with 28% planning adoption within 12–24 months.
A Vertiv/NVIDIA study found that applying direct-to-chip liquid cooling to approximately 75% of IT load delivered measurable facility-wide gains:
- Total data center power dropped 10.2%
- Total Usage Effectiveness (TUE) improved by more than 15%
- Facility power (including cooling infrastructure) fell 18.1%
- Server fan power dropped 80%
This means engineers need to model cooling infrastructure electrical loads — CDUs, pumps, heat exchangers — alongside IT loads from the start of the distribution design process, not after the rack layout is finalized.
Intelligent Monitoring and Power Management at Scale
Without granular visibility into load at the branch circuit, PDU, and rack level, operators cannot safely add capacity, identify imbalanced phases, or anticipate which circuits are approaching their rated limits. Real-time power monitoring is a scalability prerequisite, not a luxury.
Why Real-Time Monitoring is Essential
DCIM (Data Center Infrastructure Management) software bridges information across Data Center Operations, Facilities, and IT domains, replacing manual tools like Excel, Visio, and home-grown databases. It monitors critical infrastructure including intelligent rack PDUs, floor PDUs, remote power panels (RPPs), busways, UPS systems, and CRACs via SNMP, ModBus, and BacNet protocols.
Metered PDUs and DCIM integration enable proactive capacity management, letting operators add load while maintaining thermal and electrical safety margins.
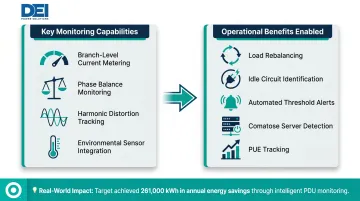
Key Monitoring Capabilities
Data center operators should look for:
- Branch-level current and power metering to track utilization per circuit
- Phase balance monitoring to prevent neutral overload in three-phase Wye configurations
- Harmonic distortion tracking — non-linear loads in AI environments can degrade equipment reliability
- Environmental sensor integration for temperature and humidity at the rack level
Harmonic distortion from VFDs and 3-phase rectifiers in chillers, CDUs, and pumps typically produces THID of 30-40%, causing excess heat in transformers, wiring degradation, and equipment faults. Tracking it early prevents failures.
How Monitoring Supports Reliability and Efficiency
With that visibility in place, real-time data enables operators to:
- Rebalance loads across phases to prevent thermal issues
- Identify idle circuits drawing phantom power
- Set automated alerts before circuits reach critical thresholds
- Identify "comatose" servers running at approximately 35% of peak power
- Track PUE and identify stranded capacity
Industry average PUE remains 1.56 (Uptime Institute Global Data Center Survey 2024), holding within a range of 1.55 to 1.59 since approximately 2020. Intelligent monitoring helps operators push below this threshold.
In one case, Target saved 261,000 kWh annually by powering down two unloaded 300 kVA PDUs identified through monitoring.
Compliance, Certification, and Equipment Standards That Matter
Power distribution equipment must meet rigorous safety, performance, and procurement standards in data center applications. Meeting these standards protects long-term reliability and prevents costly rework after inspection.
Key Standards and Certifications
| Standard | Scope | Why It Matters for Data Centers |
|---|---|---|
| NEC Article 708 (NFPA 70) | Critical Operations Power Systems (COPS) | Data centers are explicitly classified as COPS facilities. NEC 2020 mandates Surge Protective Devices (SPDs) for all COPS installations. |
| UL 891 | Dead-front switchboards, low-voltage power distribution | Most jurisdictions require UL listing for permits and inspections; insurers typically require it for coverage. |
| ANSI/IEEE C37.20.1 | Metal-enclosed low-voltage switchgear (≤1000V AC / ≤3200V DC) | Governs stationary and drawout circuit breaker assemblies in commercial and industrial applications. |
DEI Power's UL 891-certified switchboards meet all three frameworks, giving contractors and engineers code-compliant equipment that simplifies project documentation and inspection.
Domestic Manufacturing and Procurement Compliance
Government-funded or federally supported data center projects may require Buy America Build America (BABA) compliance. Enacted as part of the Infrastructure Investment and Jobs Act (IIJA) and effective May 14, 2022, BABA establishes domestic content procurement preferences for all federal financial assistance obligated for infrastructure projects.
Requirements include:
- Iron and steel: 100% domestic (all manufacturing processes must occur in the U.S.)
- Manufactured products: Greater than 55% domestic content (by cost of components)
- Construction materials: Must be manufactured in the U.S.
DEI Power's switchboards are manufactured and assembled in Ontario, California, with BABA-compliant construction, providing documentation that simplifies federal project procurement and inspection. Designers and procurement teams should verify equipment origin and documentation early in the project to avoid delivery delays or compliance findings at inspection.
Frequently Asked Questions
What is the standard power distribution architecture for a data center?
The standard hierarchy flows from utility entry and transformers → main switchgear/switchboards → UPS systems → PDUs → RPPs → rack-level connections. Each layer adds protection, redundancy, and load management capability, with isolation and fault containment designed at every tier.
How do you design data center power distribution for scalability?
Start by sizing infrastructure for your planned end-state capacity, then build out in phases using modular switchgear and PDU architectures. Pre-install cable pathways and busway systems early, and maintain 80% utilization headroom so load growth never forces costly rework or equipment replacement.
What redundancy level does a mission-critical data center need?
It depends on the required Uptime Institute Tier level. Tier III requires N+1 concurrently maintainable systems, while Tier IV requires 2N fully fault-tolerant paths. Most hyperscale and colocation facilities operate at Tier III or Tier IV standards to meet SLA commitments and minimize downtime risk.
How does AI and high-density computing change power distribution design?
GPU and AI racks drawing 40–100+ kW per rack require three-phase power delivery, higher-rated PDUs and switchgear, and integrated liquid cooling load planning. Upstream distribution capacity must scale well beyond what traditional enterprise designs supported — airflow cooling alone cannot handle densities above 40–50 kW per rack.
What is UL 891 and why does it matter for data center switchgear?
UL 891 is the safety listing standard for dead-front switchboards used in low-voltage power distribution. UL-listed equipment provides assurance of safety testing, code compliance, and reliable performance in critical power distribution applications, and is typically required by building codes and insurance providers.
What is the difference between a PDU and a switchboard in data center power distribution?
A switchboard operates at the facility level — it receives power from transformers or generators and distributes it to downstream UPS systems. A PDU works at the rack or row level, taking power from the UPS and delivering it directly to IT equipment with metering and monitoring built in.