Introduction
U.S. data centers drew 176 TWh in 2023 — more than double the 70 TWh recorded in 2014. That scale of consumption doesn't stay constant; it shifts minute by minute across thousands of servers, cooling systems, and distribution circuits.
Real-time power monitoring gives operators continuous visibility into that consumption, making it a core requirement for uptime, efficiency, and cost control.
Operating without real-time monitoring creates serious risks. Undetected load imbalances, capacity overruns, and thermal events can all trigger cascading failures. The stakes are high: 54% of significant data center outages cost more than $100,000, and 16% exceed $1 million per incident. And 52% of operators cite power as the primary cause of their most recent serious outage, which puts power monitoring at the center of any serious reliability strategy.
This guide breaks down what you need to know: why real-time monitoring matters, how to collect and interpret the right metrics, what warning signs to watch for, and how power distribution infrastructure fits into the picture.
Key Takeaways
- Real-time power monitoring delivers live visibility into energy consumption from facility feed to individual racks
- Facility-wide metrics like PUE can hide localized failures — granular monitoring catches what averages miss
- Four monitoring layers are essential — from facility-level metering down to individual devices and software
- Watch for rising PUE, load imbalances, breaker trips, unexpected spikes, and recurring hot spots
- Regular review cadences — daily through quarterly — turn monitoring data into action
Why Real-Time Power Monitoring Matters for Data Centers
Data centers operate under continuous, dynamic electrical loads that shift with workloads, cooling demands, and equipment additions. Static or periodic measurement cannot keep pace. Global data center electricity demand reached 415 TWh in 2024 — roughly 1.5% of global consumption — and is growing at 12% annually, projected to nearly double to 945 TWh by 2030. This accelerating power density means monitoring infrastructure must scale continuously.
Real-time monitoring directly affects both performance and cost. Without it, facilities face:
- Inefficient power use and unexpected demand charges
- Poor PUE scores that mask the actual source of inefficiency
- Lost ability to correlate efficiency changes with specific events — like new equipment installations or cooling adjustments
- Unreliable capacity planning and energy cost allocation
Rising regulatory and ESG reporting requirements raise the stakes further. Data center operators need accurate, continuous power data to demonstrate energy efficiency, meet SLA obligations, and report carbon emissions accurately. Periodic snapshots no longer satisfy auditors or stakeholders who expect proof of operational discipline.
Methods of Real-Time Data Center Power Monitoring
Effective power monitoring requires multiple complementary layers working together. No single method provides full visibility across the entire power distribution hierarchy. The goal is to instrument the facility at every meaningful point where power flows, creating a complete picture from utility entry to server plug.
Facility-Level / Central Metering
A central power meter sits at the utility entry point and captures total facility consumption. It drives PUE calculations and overall demand management, but offers zero granularity into where power is actually being used within the facility. Central metering typically represents The Green Grid's Category 1 (L1) measurement level — monthly readings at the UPS output.
Central metering is the starting point for any monitoring program. It's required for utility billing, demand management, and high-level sustainability reporting. However, it cannot identify which specific circuits, racks, or equipment are consuming power or creating inefficiency.
Branch Circuit Monitoring
Branch circuit monitors measure power at the panelboard or remote power panel (RPP) level — the circuits that distribute power to individual server cabinets or groups of cabinets. This gives operators visibility into how load is distributed across sections of the data floor and reveals patterns invisible at the facility level.
Branch circuit monitoring is valuable for:
- Identifying overloaded circuits before breaker trips occur
- Detecting uneven phase loading that reduces efficiency
- Assessing available capacity for new deployments
- Correlating power consumption with specific data floor zones
This method works for both new construction and retrofit scenarios. DEI Power's Remote Power Panels across the 225A to 1200A range feature optional branch circuit monitoring built into the design, supporting up to 84 monitored circuits in the 1200A model. In hyperscale data centers and AI compute halls, where power density pushes capacity margins to the limit, this built-in monitoring capability removes a significant instrumentation gap.
PDU Monitoring
At the rack level, PDU monitoring captures energy consumed by each piece of equipment connected to a cabinet. This enables cost allocation by tenant or workload and allows operators to spot idle or underutilized equipment consuming phantom loads.
Smart or metered PDUs with built-in monitoring capabilities deliver outlet-level data — the most granular point-of-use measurement available without instrumenting the server itself. This corresponds to The Green Grid's Category 3 (L3) measurement level: continuous monitoring at the IT equipment input. PDU monitoring typically tracks current, voltage, power (watts/kW), and power factor on a per-cabinet or per-device basis.
Software and Device-Level Monitoring
Software-based monitoring tools — including DCIM platforms and baseboard management controller (BMC) data from servers — complement hardware metering by correlating power data with IT workloads. This enables identification of energy-inefficient applications or VMs that consume disproportionate power relative to their computational output.
DCIM software aggregates data from all monitoring layers into dashboards, alerting systems, and historical reports, giving operators a unified view to act on power data quickly. Its accuracy, however, depends entirely on the quality and calibration of the underlying hardware sensors.
Key distinctions when evaluating software monitoring:
- Large, complex facilities benefit most from full DCIM platforms that tie together hundreds of monitoring points
- Smaller facilities can start with simpler real-time dashboards and alerting without the overhead of enterprise DCIM
- All software solutions are only as accurate as the hardware sensors feeding them — invest in quality metering first
Key Metrics and Warning Signs to Watch
Real-time monitoring only delivers value when operators know what numbers to track and what deviations signal a problem. The most dangerous issues in data centers often develop gradually before causing a failure — which is why structured metric tracking catches problems before they become outages.
Power Capacity and Load Imbalances
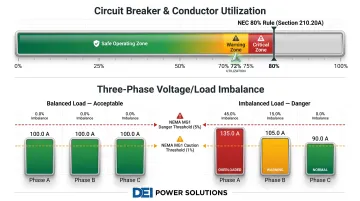
Utilization must be tracked against rated capacity at every level — circuit, panel, and PDU — to prevent breaker trips and cascading failures. The National Electrical Code (NEC) Section 210.20(A) establishes the 80% rule: continuous loads cannot exceed 80% of the overcurrent device rating. Data center IT equipment qualifies as continuous load since servers operate at steady state far longer than the NEC's three-hour threshold.
Set warning alerts at 70-75% utilization and critical alerts at 80%. Operating above this threshold violates code and creates genuine fire and safety risks.
Phase imbalance is an equally critical warning sign. When load is unevenly distributed across the three phases of a three-phase power system, efficiency drops and individual phase breakers can trip. NEMA MG1 sets a 1% voltage unbalance limit for motors and recommends against operation above 5%. Real-time monitoring allows operators to detect and rebalance before an outage occurs.
Efficiency Degradation (PUE Changes)
A rising PUE trend — even a small incremental increase — is an early indicator that cooling systems are working harder, infrastructure is losing efficiency, or phantom loads are accumulating. The global weighted-average PUE has plateaued at 1.54 for six consecutive years despite newer facilities achieving 1.48. This stagnation suggests that finding remaining efficiency gains requires deeper granularity than facility-wide averages provide.
Real-time PUE visibility lets operators correlate efficiency changes with specific events — new equipment installations, cooling adjustments, or load shifts. PUE alone, however, does not pinpoint the source of inefficiency.
When facility-wide PUE rises, granular branch circuit and PDU data must be interrogated to isolate the root cause. That level of precision requires L2 or L3 monitoring — facility averages won't get you there.
Thermal and Environmental Anomalies Tied to Power
Power consumption and heat output are directly correlated. Unexpected spikes in power draw at the rack or circuit level often precede hot spot formation. Real-time monitoring can trigger automated alerts before temperatures reach equipment-damaging thresholds, protecting against thermal events that cause permanent hardware degradation.
Cooling system underperformance shows up in a specific pattern: IT power draw stays constant while ambient temperatures rise. That combination points directly to failing cooling infrastructure. Without simultaneous power and environmental monitoring in a single platform, operators have no way to connect these two signals — the failure stays hidden until it becomes a thermal event.
Recurring Alerts and Unexplained Consumption
Repeated breaker trips, frequent resets, or circuits that regularly approach capacity limits are signs of structural load management problems — not isolated incidents. These patterns require investigation into load redistribution or capacity expansion, not just reactive resets.
Unexplained energy consumption growth is another critical warning sign. If overall facility power draw increases without a corresponding increase in IT load (new servers, additional racks), the likely culprits are malfunctioning equipment, cooling inefficiencies, or unauthorized devices. Granular real-time data catches all three; facility-level metrics miss them entirely.
The Role of Power Distribution Infrastructure in Monitoring Accuracy
The quality and design of the power distribution layer — specifically switchboards and panelboards — directly affects how accurately monitoring data can be collected. Equipment that lacks metering integration or uses outdated designs creates gaps in the visibility chain that no software can compensate for.
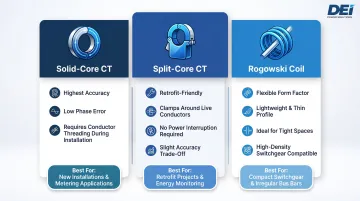
Data centers and colocation facilities should specify power distribution equipment designed with monitoring compatibility in mind — including provisions for current transformers (CTs), revenue-grade metering inputs, and communication interfaces. Three CT types are commonly used:
- Solid-core CTs — highest accuracy, but the conductor must be threaded through during installation
- Split-core CTs — clamp around live conductors for retrofit scenarios, with a slight accuracy trade-off
- Rogowski coils — flexible and well-suited for tight spaces and high-density switchgear
DEI Power's UL 891-certified low-voltage switchboards and Remote Power Panels are built for environments where monitoring accuracy is critical. Their RPPs feature optional branch circuit monitoring integrated into the design, providing visibility across up to 84 circuits in the 1200A model.
Built with genuine Siemens components at their 50,000 sq. ft. facility in Ontario, California, these panels are specified for hyperscale data centers, AI compute halls, and mission-critical facilities that require real-time power visibility from commissioning onward.
The time to plan for monitoring infrastructure is during the switchgear and panelboard specification phase. Retrofit monitoring is significantly more expensive and disruptive than building it in from the start. The Green Grid notes that obtaining measurements in existing data centers "is not a trivial task" and "costs can be quite high" to install instruments after the fact. Working with a manufacturer who understands mission-critical power requirements reduces monitoring gaps at the switchboard level — and eliminates the cost of fixing them later.
Data Center Power Monitoring Schedule
Monitoring schedules should be adapted to facility size, workload volatility, and operational criticality. A hyperscale data center with dynamic cloud workloads needs more frequent reviews than a smaller, stable enterprise facility. However, all data centers benefit from a structured cadence to ensure data is acted on rather than simply collected.
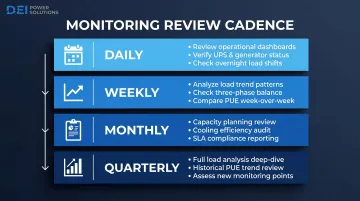
Daily Reviews:
- Review real-time dashboards for anomalies and active alerts
- Verify UPS and generator status
- Check for overnight load shifts or unexpected circuit utilization changes
Weekly Reviews:
- Analyze load trends by circuit and PDU
- Check phase balance across distribution panels
- Compare PUE against the prior week to detect efficiency drift
Monthly Reviews:
- Conduct capacity planning review against thresholds (80% rule)
- Perform cooling efficiency audit using power-temperature correlation
- Generate SLA compliance reports for internal and external stakeholders
Quarterly Reviews:
- Full load analysis against growth projections
- Review historical PUE trends to identify seasonal patterns or degradation
- Assess whether additional monitoring points are needed as infrastructure evolves
Automated alerting should complement this monitoring schedule. Critical conditions — including circuit utilization above 80%, sudden load spikes, and unexpected power loss on a monitored feed — require immediate notification, not a queued review. Configure alerts at 70-75% utilization for advance warning and at 80% for critical intervention.
Conclusion
Real-time power monitoring is an ongoing operational discipline, not a single deployment. The data is only valuable when acted upon through structured reviews, alert responses, and infrastructure adjustments that keep the facility running safely within its design parameters.
A strong monitoring program starts with the right physical infrastructure — properly specified switchgear and distribution equipment that supports metering integration from day one. Combined with the right monitoring tools and a consistent review cadence, this foundation gives data center operators the confidence that uptime, efficiency, and capacity are all under control.
When power distribution equipment is designed with monitoring compatibility built in, operators gain the visibility they need to prevent the costly, disruptive outages that remain an industry-wide risk.
Frequently Asked Questions
What is real-time power monitoring in a data center?
Real-time power monitoring is the continuous, automated measurement of electrical consumption at multiple points in the data center's power hierarchy: utility entrance, branch circuits, and individual racks. It enables operators to detect issues, balance loads, and optimize efficiency without manual intervention.
What is PUE and why does it matter for data center power monitoring?
Power Usage Effectiveness (PUE) is the ratio of total facility energy to IT equipment energy. A PUE of 1.54 means 54% more energy goes to overhead (cooling, power delivery) than to IT equipment. Because PUE doesn't pinpoint where waste occurs, granular circuit and rack-level monitoring is essential alongside facility-wide tracking.
What is the difference between branch circuit monitoring and PDU monitoring?
Branch circuit monitors measure at the panelboard level, tracking power flowing to rack groups or entire floor zones. PDU monitors operate at the rack or cabinet level, tracking individual server and network equipment consumption — providing greater granularity for cost allocation, while branch circuit monitoring reveals distribution imbalances across the facility.
How often should data center power consumption be reviewed?
Automated real-time alerting should trigger on threshold breaches (80% circuit utilization, sudden spikes, or power loss). Supplement with daily dashboard reviews, weekly trend analysis, monthly capacity planning checks, and quarterly PUE audits.
What are the most common signs of a power distribution problem in a data center?
Recurring breaker trips, phase imbalances exceeding 1%, unexplained energy consumption increases, rising PUE without new load additions, and frequent thermal alerts are the most reliable early warning signs. These patterns indicate underlying distribution issues requiring investigation before they cause outages.
Do I need DCIM software to monitor data center power in real time?
DCIM software is beneficial for aggregating and visualizing data across large, complex facilities with hundreds of circuits and racks. However, it's not strictly required for all deployments — simpler monitoring solutions with real-time dashboards and alerting can be effective for smaller facilities or organizations starting their monitoring program incrementally.