Introduction
More than two-thirds of all data center outages cost over $100,000 — and 25% exceed $1 million. The uncomfortable reality is that most of these failures don't start with a utility grid problem. They originate inside the facility — from undersized equipment, single points of failure in the distribution chain, or protection systems that weren't coordinated.
This guide is written for contractors, engineers, data center operators, and facility teams responsible for designing or maintaining reliable power infrastructure. It covers the complete distribution chain from utility entry to rack level — including efficiency best practices, redundancy design, real-time monitoring, and what to verify before procuring switchboards that frequently sit on the critical path of any data center project.
Key Takeaways
- Right-size every distribution stage — from main switchboard to PDU — and keep UPS load factors within an efficient range
- Implement N+1 or 2N redundancy matched to your uptime tier, with genuinely independent distribution paths
- Maintain higher voltage (480V) as far into the distribution chain as possible to reduce conversion losses
- Deploy real-time metering at switchboard, branch, and rack levels to track PUE and catch problems early
- Select UL 891-certified equipment with confirmed lead times — switchgear is frequently on the critical path of any data center project
The Data Center Power Distribution Chain: From Grid to Rack
How Power Moves Through a Data Center
The DOE's Best Practices Guide for Energy-Efficient Data Center Design describes the standard internal distribution chain as: utility service → main switchboard → UPS systems → PDUs → rack loads. Each stage performs a specific function, and each introduces potential failure points and efficiency losses if not properly engineered.
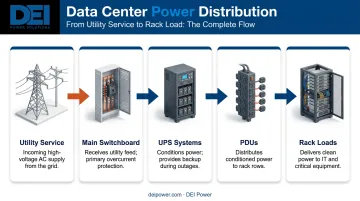
Every conversion step in that chain — AC-to-DC through the UPS, voltage step-down at the PDU, DC conversion again at the server supply — generates heat and sheds energy. LBNL data confirms this cascading loss pattern is one of the primary efficiency challenges in data center power design.
The Main Switchboard: First Line of Distribution
The main switchboard is where utility power is received, metered, and routed to downstream systems. At this layer, proper equipment rating and certification aren't optional — they're what separates a code-compliant installation from a liability.
UL 891-certified, dead-front low-voltage switchboards are the standard for this application in the U.S. Switchboards at this level must be rated for the available fault current on-site, with short-circuit current ratings (SCCR) matching or exceeding available fault current per NEC 110.9 and NEC 110.10.
DEI Power manufactures UL 891-certified switchboards from 400A to 4000A, built with Siemens Siemens components, and available in voltage configurations from 208Y/120V through 480Y/277V — covering the full range of main distribution applications in commercial and hyperscale data center environments.
UPS and PDU: Conditioning and Last-Mile Distribution
The UPS layer bridges switchboard output and IT equipment by filtering power quality issues — voltage sags, surges, and harmonics — while providing ride-through power during outages and power events. Modern double-conversion UPS systems operate at 95% efficiency or higher, compared to 85–90% in the 1990s, with eco modes reaching 99%.
PDUs take the conditioned output and distribute it to individual server racks. Metered and intelligent PDUs add capabilities that matter at scale:
- Outlet-level consumption visibility for load balancing
- Early detection of equipment drawing above expected thresholds
- Remote monitoring to reduce the need for physical walkthroughs
- Per-circuit data to support capacity planning decisions
The entire chain must be engineered as a system. When a fault event occurs, capacity mismatches, voltage class incompatibilities, or uncoordinated protection between layers don't just create inefficiency — they create the conditions for cascading failures that a well-specified design would have stopped at the source.
Power Distribution Best Practices for Maximum Efficiency
Right-Size Equipment and Manage UPS Load Factors
Running UPS systems at very low utilization is one of the most common and costly efficiency mistakes in data center operations. The Uptime Institute's 2024 Global Data Center Survey found that one in four data centers operates below 40% of available UPS capacity — a condition that actively undermines energy performance.
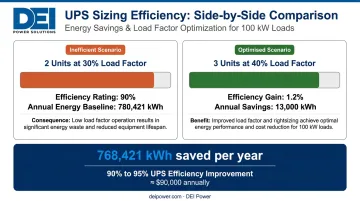
The DOE provides a concrete example: shifting from two N+1 UPS units at 30% load factor to three smaller N+1 units at 40% load factor improves efficiency by 1.2% and saves roughly 13,000 kWh per year for a 100 kW load. Those numbers compound fast in larger facilities. Proper sizing delivers:
- UPS units operating at very low load factors waste energy and generate unnecessary heat
- Modular UPS architectures let operators add capacity incrementally rather than over-provisioning upfront
- Improving UPS efficiency from 90% to 95% in a 15,000 sq ft facility at 100 W/sq ft can reduce annual energy consumption by 768,421 kWh — approximately $90,000 per year at $0.12/kWh (DOE, 2024)
Maintain Higher Voltage Deeper Into the Distribution Chain
Every AC-to-DC or voltage step-down conversion introduces losses. The DOE recommends maintaining higher voltage as far into the distribution path as possible and placing voltage regulators close to the load.
Removing transformers that step power down to 208V or lower can produce efficiency gains of 2% or more, according to Eaton's circuit protection guidance. At 480V, a 20A circuit can deliver 13.3 kW; at 208V, the same circuit delivers only 5.8 kW — which is why voltage class selection is a foundational distribution design decision.
Switchboards and RPPs configured for 480V and 480Y/277V support higher-voltage distribution closer to the rack — reducing conversion stages without requiring changes at the main distribution level. DEI Power's product line covers both configurations in pre-engineered, UL 891-certified assemblies sized from 400A to 4000A.
Phase Balancing and Load Audits
Phase balancing and periodic load audits are two efficiency levers that require no capital expenditure — yet consistently get overlooked.
Unbalanced three-phase loads increase neutral current, generate heat, and shorten equipment life. Monitoring load distribution across phases and redistributing circuits when imbalances develop improves both efficiency and safety.
Load audits work differently but deliver comparable impact. Comparing nameplate ratings against actual measured consumption consistently surfaces phantom capacity — circuits provisioned for loads that were consolidated, virtualized, or decommissioned. Identifying and reclaiming those circuits reduces idle infrastructure losses and defers capital expansion.
Designing Redundancy Into Your Power Distribution System
The Three Redundancy Tiers
Data center redundancy design centers on three primary configurations:
| Configuration | Structure | Best For |
|---|---|---|
| N+1 | One backup component per critical path | Tier 2–3 facilities; lower capital cost |
| 2N | Full duplication of every power path | Tier 3–4 and mission-critical deployments |
| 2N+1 | Full duplication plus one additional backup | Hyperscale, financial services, highest uptime demands |
N+1 protects against a single component failure. 2N eliminates any single point of failure by feeding dual-corded servers from completely independent sources. The choice between them comes down to the facility's uptime tier requirements and risk tolerance.
Dual-Corded Servers: Only as Good as the Independence Behind Them
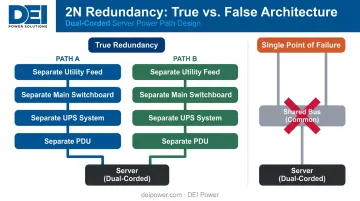
A common and expensive design error: creating "redundant" power paths that converge on a shared upstream bus or switchboard. Dual-corded servers provide genuine protection only when both cords trace back to:
- Separate utility feeds
- Separate main switchboards
- Separate UPS systems
- Separate PDUs
If any of those elements are shared, the apparent redundancy collapses under a single-point failure scenario. Resolving this belongs at the single-line diagram stage, not during installation.
Automatic Transfer Switches and Protection Coordination
ATS units make redundancy actionable. When the primary feed is lost, a fast-acting ATS detects the failure and transfers load to the backup source, preventing UPS batteries from draining before a generator comes online. Key ATS performance benchmarks under NEC Article 700:
- Emergency systems must complete transfer within 10 seconds
- Open in-phase transitions typically complete in 150 ms or less
Protection coordination is where many facilities carry hidden vulnerabilities. NEC 645.27 requires overcurrent protective devices (OCPDs) in critical operations data systems to be selectively coordinated — meaning a rack-level fault clears at the nearest upstream breaker without tripping the main bus. When coordination is wrong, a localized fault becomes a facility-wide outage. Verify this through an engineering study; don't assume it's correct.
Real-Time Power Monitoring and PUE Optimization
Understanding PUE Benchmarks
Power Usage Effectiveness (PUE) — total facility power divided by IT equipment power — is the standard efficiency benchmark for data centers. A PUE of 1.0 is theoretical perfection; every decimal point above that represents overhead consumed by cooling, lighting, and power distribution losses.
Current benchmarks from verified 2024 sources:
- Industry average PUE: 1.56 (Uptime Institute 2024 Global Survey)
- DOE "better" benchmark: 1.1
- Google's global fleet average: 1.09 (2024)
Improving PUE by even 0.1 at meaningful facility scale translates to substantial annual savings. The distribution system is a direct contributor to PUE — every conversion loss and stranded circuit shows up in the denominator.
Building a Comprehensive Monitoring Stack
Effective monitoring requires visibility at multiple levels:
- Utility/switchboard level: Tracks total facility consumption, demand trends, and power factor across the entire feed
- Branch circuit level (PDU): Reveals per-circuit load, phase balance, and remaining capacity headroom
- Outlet level (high-density racks): Exposes per-server consumption and catches anomalies before they cascade
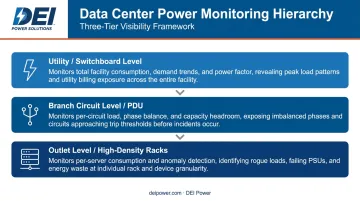
At the branch level, DEI Power's remote power panels support monitoring across up to 84 circuits — giving operators the granularity needed to identify imbalances and track PUE contributions directly at the distribution layer.
From Data to Action
Collecting granular data is only half the equation — acting on it quickly is what separates reactive operations from resilient ones. Real-time dashboards and alert thresholds turn raw metering data into preventive maintenance. Anomaly detection flags rising circuit loads, phase imbalances, or temperature-correlated power spikes before they escalate.
Sequence-of-event recorders (SERs) add another layer of accountability. They generate millisecond-timestamped logs essential for root-cause analysis after a disturbance — and without that record, investigations rely on incomplete memory and assumptions rather than facts.
How to Choose the Right Power Distribution Equipment
Selection Criteria for Data Center Switchboards
Equipment selection for data center power distribution involves more variables than voltage and amperage. Key criteria:
- Voltage class and amperage matched to actual load, with documented headroom for planned growth
- UL 891 certification — the code compliance standard for low-voltage switchboards in U.S. installations
- SCCR rated to available fault current at the point of installation (NEC 110.9, 110.10)
- Breaker coordination with downstream protection, verified through a coordination study
- Configuration accuracy — equipment built to the project's exact layout, voltage, and feed requirements reduces field adjustments and change orders that delay commissioning
Equipment that arrives pre-engineered to project specs integrates faster, requires fewer field modifications, and commissions on schedule. That outcome depends on specifying correctly upfront — and choosing a manufacturer that builds to those specs, not around them.
DEI Power's switchboards (400A–4000A) and remote power panels (225A–1200A) are custom-manufactured to project specifications at their 50,000 sq. ft. facility in Ontario, CA, with voltage options from 208Y/120V through 480Y/277V.
In-stock units ship within one business day; custom-configured orders complete in 4–6 weeks — faster than the 16-week lead times common from overseas or heavily backordered domestic suppliers.
Lead Time as a Procurement Risk Factor
Switchgear sits on the critical path of nearly every data center construction or expansion project. A delayed switchboard delays the entire commissioning sequence — mechanical, controls, and IT buildout all wait.
Evaluating a manufacturer's fulfillment track record should carry the same weight as evaluating the equipment specification. Relevant questions:
- Is equipment assembled in-house or sourced through a supply chain with its own vulnerabilities?
- What is the realistic lead time for the specific configuration required?
- Can the manufacturer document on-time delivery performance?
DEI Power's domestic manufacturing and in-house assembly eliminate the offshore supply chain risk that has pushed lead times to six months or more at some suppliers. For time-sensitive projects, that lead time advantage is often what keeps the project on schedule.
Documentation Before Order Placement
Undersized or incorrectly specified switchgear is an expensive problem. Field modification and full replacement are both avoidable — if the specification review happens before order placement. Contractors and engineers should require:
- Single-line diagrams reflecting the actual configuration
- Bill of materials confirming components and ratings
- Configuration confirmation against the project specification
- UL certification documentation
DEI Power provides submittal documentation with each order — finalized drawings, BOM confirmation, and engineering support through the specification review process — covering ratings, enclosure selection, and compliance documentation to reduce rework risk.
Frequently Asked Questions
What is the difference between N+1 and 2N redundancy in a data center power system?
N+1 adds one backup component beyond what's needed to support the load — protecting against a single failure at lower capital cost. 2N fully duplicates every power path, feeding equipment from two completely independent sources. Tier III facilities typically require N+1 as a minimum; Tier IV demands 2N throughout.
What is PUE and what is considered a good PUE for a data center?
PUE is total facility power divided by IT equipment power — a lower number means more efficient operation. The current industry average is 1.56 per the Uptime Institute's 2024 survey; the DOE's "better" benchmark is 1.1, and Google's global fleet averaged 1.09 in 2024. World-class facilities consistently operate below 1.2.
How do UPS systems and switchboards work together in the power distribution chain?
The switchboard receives utility power and routes it to the UPS, which conditions and stabilizes it before delivering output to PDUs and IT equipment. Both must be correctly sized and coordinated — mismatches between UPS capacity and switchboard ratings create failure modes that only surface during a fault event.
What does UL 891 certification mean for a data center switchboard?
UL 891 is the ANSI/UL standard for low-voltage switchboards, covering equipment under 1000V. Certification confirms the equipment has been evaluated to meet established safety and performance requirements and is intended for installation per the NEC. For U.S. data center installations, UL 891 listing is the baseline compliance marker.
What are the most common causes of data center power outages?
Per Uptime Institute's 2023 outage analysis, UPS failure leads at 40% of major power-related outages, followed by generator and transfer switch failure (27% each), PDU failure (15%), and single-corded IT devices (14%). Across all categories, human error — missed procedures or flawed runbooks — contributes to two-thirds to four-fifths of all outages.
How should I size power distribution equipment for a data center expansion?
Size equipment against current measured load — not nameplate ratings — and build in headroom for projected growth. The DOE flags UPS utilization below 40% of available capacity as a measurable drag on energy performance, so avoid oversizing to the point of chronic underloading. Validate all sizing against actual consumption data before specifying equipment.