Introduction
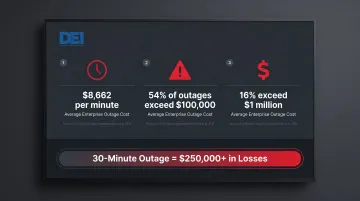
Data centers operate on massive electrical infrastructure where a momentary power anomaly can crash server racks, trigger cascading failures, and generate costs exceeding $100,000 per hour in downtime. According to Uptime Institute's 2024 Annual Outage Analysis, power issues account for 52% of impactful data center outages, with 54% of serious incidents costing more than $100,000 and 16% exceeding $1 million. For facility teams and engineers managing this infrastructure, power visibility isn't optional. It's the foundation of uptime.
Power monitoring in Data Center Infrastructure Management (DCIM) means continuous, automated collection and analysis of electrical data across every layer of the power chain: from the utility feed through switchboards and UPS units, down to individual rack loads.
Unlike manual inspections that capture static snapshots, real-time monitoring detects developing issues — circuit overloads, phase imbalances, voltage drift — before they breach thresholds and trigger failures.
This article covers what you need to implement effective power monitoring: the metrics that matter most, how monitoring fits into the distribution hierarchy, the operational benefits it unlocks, and practical strategies for integrating monitoring into both new construction and retrofit projects.
TLDR:
- Power issues cause 52% of outages; monitoring shifts teams from reactive to proactive
- Key metrics to track: current, voltage, power (W/kVA), energy (kWh), and power quality (THD, PF)
- Instrument every tier — switchgear, RPPs, and rack PDUs — to catch problems before they escalate
- Operational gains include PUE improvement, ghost server detection, and capacity reclamation
- Retrofits use split-core CTs and wireless meters; new builds can design monitoring in from the start
Why Power Monitoring Is Critical for Data Center Operations
Unlike commercial buildings, data centers face uniquely high consequences for power blind spots. Dynamic, constantly shifting loads across hundreds of circuits mean that without real-time visibility, overloads and cascading failures develop faster than manual inspection can catch them.
The Core Risk of Operating Blind
Undetected circuit overloads, phase imbalances, and power quality degradation accumulate silently until a breaker trips or equipment fails—by which point the damage to uptime and hardware is already done. The Uptime Institute found that 80% of serious outages could have been prevented with better management, processes, and configuration—a finding that directly implicates lack of visibility as a leading failure mode.
Power consumption in data centers is not static. AI and high-density compute workloads are significantly increasing per-rack power demand. According to the Uptime Institute's 2024 Global Data Center Survey, only approximately 1% of operators report racks exceeding 100 kW. Yet NVIDIA's NVL72 AI training system demands 132 kW per rack. Infrastructure that was adequately sized and balanced a few years ago may now be operating dangerously close to its limits without operators knowing.
Downtime Cost Reality
That infrastructure risk translates directly into financial exposure. The numbers are severe:
- 54% of significant outages cost over $100,000
- 16% exceed $1 million
- Ponemon Institute cites an average of $8,662 per minute for unplanned enterprise outages
SLA penalties, customer churn, and hardware replacement push the real cost well beyond the initial outage figure. At $8,662 per minute, even a 30-minute event clears $250,000 — before any downstream consequences are counted.
From Reactive to Proactive
DCIM power monitoring gives engineering teams the visibility to catch risk before thresholds are breached — not after a breaker trips. Threshold-based alerts, trending analysis, and predictive insights allow maintenance to be scheduled during planned windows, protecting both uptime SLAs and capital equipment from avoidable damage.
Key Power Metrics Every Data Center Should Track
Not all electrical parameters matter equally. Focus on these five core metrics to build actionable visibility:
Current (Amperes)
Monitoring current at the rack, panel, and branch-circuit level confirms loads stay within safe limits and prevents breaker trips. In three-phase systems, tracking per-phase current balance is critical. Uneven loading shortens equipment life, reduces efficiency, and can trip breakers even when total load appears safe.
Industry standards define strict limits: 1% voltage unbalance (per NEMA MG 1-2021) can produce 10% current unbalance, resulting in 21% additional heat in transformers and motors.
Voltage (Volts)
Both over-voltage and under-voltage conditions degrade sensitive equipment. The ITIC (Information Technology Industry Council) curve defines acceptable boundaries: ±10% of nominal voltage for steady-state operation, with brief tolerance for deeper sags during switching events.
Stable voltage at every distribution point—from the switchboard through Remote Power Panels (RPPs) to rack PDUs—is a baseline requirement for reliable server and network hardware operation.
Active Power (Watts) and Apparent Power (kVA)
Both metrics serve distinct planning purposes:
- Active power (W): drives capacity planning and energy cost calculations
- Apparent power (kVA): combined with power factor, reveals distribution efficiency
Modern server power supplies typically exhibit 0.93 to 0.99 power factor at 50% load or above (80 Plus Platinum/Titanium certified), but legacy equipment or poorly specified hardware can drop as low as 0.5–0.6, wasting distribution capacity.
Energy Consumption (kWh)
Cumulative energy tracking over time reveals:
- Consumption trends for capacity planning
- Cost allocation to business units or colocation tenants
- Ghost servers drawing power without contributing workload
- Accurate PUE calculations for efficiency benchmarking
Lawrence Berkeley National Laboratory estimates up to 30% of servers may be zombies, drawing 10–30% of full power while performing no useful work. Branch-circuit energy monitoring is the most reliable way to detect them.
Power Quality Indicators
Voltage spikes, harmonic distortion, and poor power factor cause long-term damage to electronics, often without triggering alarms until hardware failures occur.
Two indicators to track closely:
- Total Harmonic Distortion (THD): IEEE 519 sets voltage THD limits at 5% for general systems and 3% for special applications such as hospitals and airports. A Bloomberg analysis using 770,000 residential sensors found that 75% of locations with persistently high THD were within 50 miles of large data centers, showing how unmanaged data center loads can degrade upstream grid quality.
- Power Factor: Measures how effectively apparent power converts to real work. Below 0.9, it wastes distribution capacity and can trigger utility surcharges. Modern data centers should target 0.95 or higher at all load levels.
The Power Distribution Hierarchy: Where Monitoring Lives
Effective monitoring requires instrumentation at multiple levels, not just at the utility meter. Knowing where each layer sits in the power chain determines where sensors and meters belong.
The Complete Power Chain
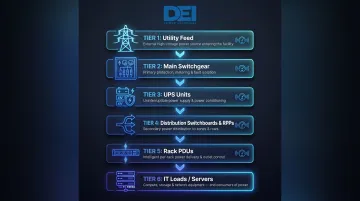
Power flows through a defined hierarchy in data centers:
- Utility Feed – Service entrance or automatic transfer switch
- Main Switchgear/Switchboard – Primary distribution point; divides incoming power into branch circuits
- Uninterruptible Power Supplies (UPS) – Battery backup and power conditioning
- Distribution Switchboards and Remote Power Panels (RPPs) – Room-level distribution to downstream panels
- Rack Power Distribution Units (PDUs) – Final distribution to IT equipment
- IT Loads – Servers, network equipment, storage arrays
Switchgear and Switchboards: The Foundation Layer
Switchgear and switchboards serve as the primary distribution point where power enters the facility and is divided into branch circuits. Properly specified, UL 891-certified switchboards (such as those manufactured by DEI Power) provide the code-compliant foundation on which downstream monitoring systems depend.
DEI Power's switchboards are built with genuine Siemens components, covering amperage ranges from 400A to 4000A, and are available in NEMA 1 (indoor) and NEMA 3R (outdoor weather-resistant) enclosures. Building this layer correctly from the start, with monitoring-compatible configurations and service-friendly layouts, reduces field adjustments and integration complexity when instruments are added later.
Branch Circuit and Panelboard Monitoring
Current transformers (CTs) and panel-level power meters installed at Remote Power Panels and distribution boards give engineers granular circuit-level visibility—essential for identifying which circuits are approaching the NEC's 80% continuous load threshold before breakers trip.
DEI Power's RPPs, which range from 225A to 1200A, can be configured with branch circuit monitoring for up to 84 circuits, providing real-time visibility into load distribution and enabling proactive maintenance.
Rack-Level Monitoring
Outlet-metered PDUs and multi-circuit monitoring devices provide device-level power consumption, per-outlet load data, and three-phase balance at the rack. This data feeds DCIM software for real-time dashboards, threshold alerts, and capacity planning.
Split-core current transformers (such as those in Schneider Electric's PowerLogic BCPM) enable retrofit monitoring with zero downtime, measuring up to 84 circuits per device with a dynamic range from 0.25 to 100 amps.
What Power Monitoring Enables: Uptime, Efficiency, and Cost Savings
The operational case for power monitoring comes down to three areas where the data translates directly into dollars and uptime.
Uptime and Fault Prevention
Threshold-based alerts on circuit, panel, and rack loads allow teams to act before minor anomalies become outages. Combined with automated failover simulations to test redundancy under loss-of-circuit scenarios, monitoring ensures that backup systems will perform when needed.
Health polling of PDUs and monitoring devices also ensures the monitoring infrastructure itself remains functional—a critical feedback loop that prevents silent failures in the visibility layer.
Energy Efficiency and PUE Improvement
Granular consumption data enables:
- Identifies idle "ghost" servers — up to 30% of servers may be drawing 10-30% of full power while doing nothing
- Calculates PUE automatically across sites at Level 3 (15-minute interval) precision per Green Grid methodology
- Compares device-level efficiency to support consolidation or upgrade decisions
- Enables safe cooling set-point increases — each 1°F rise saves approximately 4% in energy costs, provided equipment stays within ITIC voltage and temperature tolerances
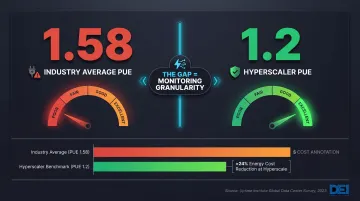
The industry average PUE has plateaued at 1.58 (Uptime Institute, 2023), while hyperscalers report 1.2 or lower. That gap largely comes down to monitoring granularity, not hardware generation.
Capacity Optimization and Cost Reduction
Monitoring reveals stranded power capacity—circuits and racks with unused headroom—that can be reallocated to new deployments, deferring capital expenditures for new infrastructure. Data centers commonly provision 30% more power than expected peak demand; real-time visibility enables dynamic right-sizing.
For colocation providers, monitoring enables:
- Accurate tenant billback with time-of-use metering
- SLA validation with documented uptime and power quality
- Avoidance of peak demand surcharges through load balancing
Power Monitoring for New Construction vs. Retrofit Projects
Monitoring strategies differ significantly between greenfield builds and live facility upgrades.
New Construction: Design It In
Data center builds present the best opportunity to instrument every layer of the power hierarchy from day one. Panelboards, RPPs, UPS units, and rack PDUs can all be specified with monitoring-compatible configurations.
Planning sensor placement, separating data cable routing from power lines, and integrating control room systems into the design prevents costly rework and ensures monitoring is operational at commissioning. DEI Power's switchboards and RPPs, for example, can be pre-wired with provisions for branch circuit monitoring and advanced metering — eliminating field integration work and reducing commissioning time.
JLL's 2026 Global Data Center Outlook projects 97 GW of new capacity between 2025 and 2030, requiring up to $3 trillion in investment. With construction costs rising at 7% CAGR, designing monitoring in from day one consistently costs less than retrofitting it later.
Retrofit Projects: Non-Intrusive Solutions
Existing data centers being expanded or upgraded face the challenge of adding monitoring without disrupting live operations. Wireless monitoring solutions and multi-circuit meters make retrofitting practical and cost-effective:
Split-core CTs snap around existing live conductors without requiring circuit disconnection, enabling zero-downtime installation. Schneider Electric's PowerLogic BCPM, for example, monitors up to 84 circuits per device with a range of 0.25 to 100 amps.
When new equipment like updated switchboards or RPPs is brought in during a retrofit, that's a natural point to specify monitoring-compatible distribution hardware. Pre-wired provisions for metering can be built into the replacement equipment, avoiding a second round of field work later.
Monitoring as the Retrofit Starting Point
Whether the project is a full retrofit or a targeted equipment swap, power monitoring data should drive the work:
- Baseline measurements identify where to focus investments
- Real-time data validates whether changes are achieving goals
- Post-retrofit comparisons confirm efficiency gains or capacity increases
Best Practices for Implementing Data Center Power Monitoring
Start Layered, Not All-at-Once
Deploy monitoring incrementally, beginning with the highest-risk circuits and highest-density racks. This delivers faster ROI and keeps the rollout manageable — the circuits listed below typically generate the most actionable data.
Focus first on:
- Main switchgear and distribution boards
- Circuits feeding critical compute (AI/GPU clusters)
- Highest-density racks (>20 kW)
- Circuits approaching capacity thresholds
Set Meaningful Thresholds and Alerts
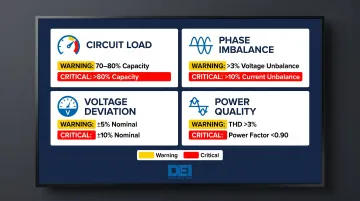
Configure warning and critical thresholds before go-live. Establish warning and critical thresholds based on:
- Circuit load: 70-80% of rated capacity (aligned with NEC's 80% continuous load rule)
- Phase imbalance: >3% voltage unbalance or >10% current unbalance
- Voltage deviation: Beyond ±5% of nominal (tighter than ITIC's ±10% to provide early warning)
- Power quality: THD >3% or power factor <0.90
Ensure alerts route to the right personnel through multiple channels: email, SMS, DCIM dashboard, and integration with existing ticketing or monitoring systems.
Integrate with DCIM Software
Those alerts need somewhere to land. Centralizing raw meter data in DCIM software transforms individual readings into an operational picture. Look for platforms that provide:
- Trend analysis to catch gradual degradation before it becomes a failure
- Capacity reports that surface headroom and stranded capacity by rack or zone
- PUE dashboards with automated calculations per Green Grid methodology
- Tenant-level energy reporting for colocation billing and SLA verification
This data must be preserved as a long-term system of record for capacity planning, regulatory compliance (such as Germany's PUE 1.2 requirement by July 2026), and SLA documentation.
Frequently Asked Questions
What is the difference between power monitoring and energy monitoring in a data center?
Power monitoring tracks real-time electrical parameters—current, voltage, active power—to manage load and safety. Energy monitoring tracks cumulative consumption (kWh) over time for efficiency analysis, cost allocation, and PUE reporting. Effective DCIM deployments require both to balance immediate operational safety with long-term efficiency optimization.
What power metrics are most important to monitor in a data center?
The core metrics are current (A), voltage (V), active power (W), apparent power (kVA), energy consumption (kWh), and power quality indicators (power factor, THD). Current and voltage ensure safety and code compliance; power metrics drive capacity planning; energy data supports cost allocation and PUE; power quality protects hardware longevity.
How does power monitoring help prevent data center downtime?
Threshold alerts on circuits approaching overload, failover simulations to validate redundancy, and early detection of power quality issues allow teams to resolve problems before a breaker trips or equipment fails. Since power issues cause 52% of impactful outages, monitoring provides the earliest possible warning system for the most common failure mode.
What is PUE and how does power monitoring support it?
Power Usage Effectiveness (PUE) is total facility power divided by IT equipment power, with a theoretical ideal of 1.0. Monitoring systems calculate it automatically using metering at the utility entrance and at rack PDUs. Continuous 15-minute interval data provides the granularity required for regulatory compliance, including mandates like Germany's 1.2 PUE target.
Why does three-phase power balance matter for data center monitoring?
Uneven loading across the three phases of a power circuit reduces distribution efficiency, can trip breakers on rack PDUs, and shortens equipment lifespan. A 3% voltage unbalance produces approximately 10% current unbalance, resulting in 21% additional heat. Monitoring per-phase current enables teams to identify and correct imbalances before they cause failures or degrade hardware.
How is power monitoring different for a new data center build versus a retrofit?
New builds allow monitoring hardware to be specified from the design phase, ensuring full coverage at commissioning with optimal CT placement and wiring. Retrofits rely on non-intrusive tools like clamp-on split-core CTs and wireless multi-circuit meters that add visibility without disrupting live operations.
Final Thoughts
Tiered power monitoring—from utility entrance through branch circuit to rack PDU—gives facility teams and engineers the data needed to meet regulatory PUE targets, reclaim stranded capacity, catch power quality issues before they cause outages, and handle the density demands of AI workloads.
Getting there starts with the distribution infrastructure upstream: properly specified switchgear and RPPs with integrated metering capability make monitoring deployments faster, cleaner, and more reliable from day one.