Introduction
Utility-scale solar has moved from emerging technology to grid backbone. In 2024, the United States added 30.8 GW of utility-scale solar capacity, and in 2026, solar accounted for 51% of all planned U.S. generating capacity additions — more than any other energy source. These aren't rooftop panels or commercial installations. They're grid-scale power plants designed to feed electricity directly into transmission networks, operate under wholesale market rules, and supply power through long-term contracts.
What separates utility-scale solar from smaller systems is the scope of infrastructure required. A typical project needs 6–8 acres per megawatt, involves multiple regulatory agencies, and depends on code-compliant electrical equipment to meet utility interconnection standards.
For engineers, EPC contractors, and facility teams, the technical challenge isn't just installing panels — it's navigating a multi-phase development process, coordinating permitting across federal and state jurisdictions, and ensuring every component of the power conversion chain meets code requirements and project timelines.
That coordination is where projects most often break down. Interconnection queue delays now average 55 months, transformer lead times are reaching 128 weeks, and mismatched electrical equipment can trigger costly field adjustments late in construction. Getting these projects commissioned on time requires early procurement of compliant equipment, clear documentation, and tight coordination across engineering, permitting, and construction phases.
Utility-Scale Solar: Quick Facts (TLDR)
- Utility-scale solar starts at 1 MWac minimum capacity and feeds power directly into the transmission grid for wholesale distribution
- Projects require 6–8 acres per MWac and a development timeline of 12–36 months from site selection to commissioning
- Key components include PV modules, inverters, combiner boxes, UL 891-certified switchgear, step-up transformers, and SCADA monitoring systems
- Unsubsidized LCOE runs $38–78/MWh (avg. $58/MWh) — among the lowest-cost sources of new generation in the U.S.
- Projects require federal, state, and local permitting, including FERC interconnection studies, NEPA compliance, and utility approval
What Is Utility-Scale Solar? Definition, Scale, and Types
Utility-scale solar refers to large solar installations designed to supply electricity directly to the transmission grid rather than serving a single on-site customer. These facilities function like traditional power plants — they participate in wholesale electricity markets, connect to high-voltage transmission infrastructure, and typically operate under long-term power purchase agreements (PPAs) with utilities or corporate offtakers.
The industry broadly accepts 1 MWac as the minimum threshold for utility-scale classification, though regulatory definitions vary by state. North Carolina sets the bar at 2 MW for its Utility-Scale Solar Project Decommissioning Program, while New York applies "major renewable energy facility" classification at 25 MWac. Most U.S. projects fall in the 1–20 MWac range, but landmark installations exceed 500 MW.
Scale comparison:
- Residential solar: 5–15 kW
- Commercial/C&I solar: 100 kW–1 MW
- Utility-scale solar: 1 MW–500+ MW
Commercial and C&I systems offset on-site energy consumption for a specific property or facility. Utility-scale plants serve no single end-user. They feed power directly into the grid for broad distribution.
Types of Utility-Scale Solar Plants
Four plant configurations make up the utility-scale solar market, each suited to different land, geography, and grid conditions:
- Ground-mounted solar farms dominate new U.S. capacity. These fixed-tilt or tracking systems are optimized for maximum sun exposure on open land. Single-axis tracking now accounts for over 90% of new installations, delivering 20–25% more energy annually versus fixed-tilt designs.
- Floating solar installations deploy arrays on reservoirs and calm bodies of water. Global capacity reached approximately 5.9 GW by 2023, with Wood Mackenzie projecting 77 GW installed globally by 2033. Passive cooling from water contact improves panel efficiency, and the approach reduces land-use conflicts in land-constrained regions.
- Concentrating Solar Power (CSP) plants use mirrors or lenses to focus sunlight, generating heat that drives a turbine. The U.S. operates approximately 1,481 MW of CSP capacity across seven facilities, including Solana (296 MW, parabolic trough) and Ivanpah (393 MW, power tower). CSP can integrate thermal storage without batteries, though no new U.S. projects are currently planned — falling PV costs have largely displaced it.
- Community solar gardens are smaller shared arrays (typically under 5 MW) where subscribers receive bill credits for their share of power produced. These serve renters, businesses, and homeowners who can't install on-site solar, extending utility-scale infrastructure to distributed access.
Core Technologies and Electrical Infrastructure of a Utility-Scale Solar Plant
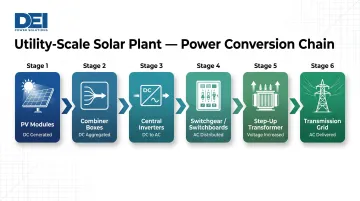
A utility-scale solar plant converts sunlight to grid-ready electricity through a precisely engineered power conversion chain:
PV modules generate DC electricity → Combiner boxes aggregate DC output → Central inverters convert DC to AC → On-site switchgear and switchboards manage AC distribution → Step-up transformers increase voltage for transmission → The grid receives high-voltage AC power
Every link in this chain must meet utility standards for power quality, reliability, and code compliance. Undersized or non-compliant equipment triggers costly change orders, commissioning delays, and field adjustments.
PV Modules and Tracking Systems
Utility-scale projects predominantly use high-efficiency monocrystalline panels paired with single-axis tracking systems, which increase annual output by 20–25% compared to fixed-tilt installations. Bifacial modules — which capture sunlight on both front and rear surfaces — now account for a growing majority of new deployments. According to NREL's 2024 Annual Technology Baseline, bifacial modules are projected to exceed 60% global market share by 2032, up from roughly 10% in 2018. When paired with single-axis tracking and optimized ground albedo, bifacial designs deliver an additional 5–15% energy gain.
Inverters
Central inverters dominate utility-scale applications, typically managing 1–3 MW each. The DOE's 100 MWdc utility-scale benchmark models a system using 19 central inverters rated at 4 MWac each, yielding 76 MWac total AC output. Multiple inverters provide redundancy and allow optimized output across large arrays.
Power quality compliance is non-negotiable for grid interconnection. Inverters must meet utility-specific standards for voltage regulation, frequency stability, and harmonic distortion.
Switchgear and Power Distribution Equipment
After inverters convert DC to AC, on-site substations manage power distribution before step-up. This stage includes low-voltage switchboards, protection relays, and disconnect equipment that safely route AC power and isolate faults. UL 891-certified switchgear is required for systems rated at 1,000V or less, ensuring compliance with NEC Article 690 (Solar Photovoltaic Systems) and utility reliability standards.
Switchgear at this stage must be precisely configured for the project's voltage, amperage, and layout. DEI Power, for instance, manufactures UL 891-certified switchboards rated from 400A to 4000A, built with Siemens components and available in NEMA 1 (indoor) and NEMA 3R (outdoor weather-resistant) configurations. As an approved Siemens OEM, DEI Power delivers custom builds in 4–6 weeks — well under the industry average of 12+ weeks. Their domestic manufacturing in Ontario, California also supports BABA compliance for federally funded projects.
Monitoring and Control Systems
SCADA (Supervisory Control and Data Acquisition) systems provide real-time monitoring of performance, weather conditions, and equipment status. These platforms enable predictive maintenance, performance optimization, and grid reporting compliance. Advanced SCADA deployments now integrate AI-driven analytics for fault detection and proactive issue resolution, reducing unplanned downtime and keeping performance ratios within target thresholds.
Development and Implementation: From Site Selection to Grid Connection
Phase 1 – Site Selection and Feasibility
Developers assess land based on solar irradiance data, topography, proximity to transmission infrastructure, and land-use classification. Sites must demonstrate strong solar resource availability (measured in kWh/m²/day), minimal shading, and flat or gently sloped terrain. Proximity to existing transmission lines reduces interconnection costs. The land-to-output ratio typically falls in the 6–8 acres per MWac range, though empirical studies show median densities of 0.28 MWac/acre (approximately 3.6 acres per MWac) depending on tracker type and panel spacing.
Yield modeling and cost analysis determine project feasibility. Developers project annual energy production, LCOE, and payback timelines using irradiance measurements, equipment specs, and financing assumptions.
Phase 2 – Permitting and Regulatory Approval
Utility-scale solar projects navigate a multi-layered regulatory process:
- Federal: Projects on federal lands require a BLM Right-of-Way (ROW) grant under the Federal Land Policy and Management Act. The process involves NEPA environmental review, including Environmental Impact Statements, inter-agency consultation, public meetings, and site surveys. The full ROW process typically takes 3–5 years.
- State: Land-use permits and environmental reviews vary significantly by state — California's AB 205 streamlined certain reviews, but most states still require separate CEQA or equivalent assessments that can add 12–24 months.
- Local: Zoning approvals and county-level permitting often surface the most project-specific obstacles, including agricultural land conversion disputes and setback requirements that vary by jurisdiction.
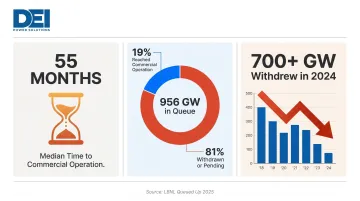
Interconnection queue delays have become the dominant bottleneck. Lawrence Berkeley National Laboratory's 2025 "Queued Up" report found a median wait time of 55 months (approximately 4.5 years) for projects reaching commercial operation. Total solar capacity in U.S. queues stands at 956 GW, but only 19% of projects that entered queues between 2000 and 2019 reached commercial operation by 2024. Over 700 GW withdrew from queues in 2024 alone. FERC Order 2023 now requires developers to demonstrate 90% site control before entering the queue, aiming to reduce speculative entries.
Phase 3 – Financing and Power Purchase Agreements (PPAs)
Utility-scale projects are financed through a combination of debt and equity, with bankability dependent on signed PPAs. Long-term PPAs — typically 15–25 years — with utilities, corporations, or government entities provide the revenue certainty lenders require for project finance closing.
NREL's project finance benchmark models a typical capital stack for utility-scale solar:
- Tax equity: 35% (7.2% after-tax return)
- Term debt: 40% (4.9% interest rate)
- Sponsor equity: 25% (7.3% after-tax return)
The partnership flip structure is the dominant tax equity arrangement, where the tax equity investor receives the bulk of ITC and depreciation benefits until a pre-determined flip point. Once financing closes and PPAs are executed, the project moves into engineering and construction — where procurement timing becomes the next critical variable.
Phase 4 – Engineering, Procurement, and Construction (EPC)
EPC contractors design and build to schedule, budget, and performance specifications. Equipment procurement must align with both project specs and delivery timelines — a challenge that has grown significantly as supply chains tighten.
Key equipment lead-time pressures in 2024–2025:
- Transformers: Lead times now reach 128 weeks; transmission-scale units can require 3–6 years
- Transformer pricing: Up 77% since 2019
- Switchgear: Industry averages exceed 12 weeks; domestic manufacturers with in-house production (such as DEI Power's Ontario, California facility) offer 4–6 week lead times
Early procurement of long-lead equipment is now a critical-path activity. Sourcing from vertically integrated domestic manufacturers directly reduces schedule risk and limits exposure to import delays.
Phase 5 – Commissioning and Grid Interconnection
Final system testing includes verifying inverter performance, switchgear functionality, SCADA integration, and compliance with utility interconnection requirements. Interconnection agreement execution with the regional utility allows the system to begin feeding power to the grid. Most systems are built for 25–30 year lifespans, with operations and maintenance (O&M) personnel taking over post-commissioning.
Cost, Economics, and Key Benefits
LCOE and Cost Breakdown
Lazard's 18th edition LCOE+ report (2025) places unsubsidized utility-scale solar LCOE at $38–78/MWh, with an average of $58/MWh — a 4% year-over-year decrease. The tightening range reflects a maturing market where lenders and developers can model costs with greater confidence.
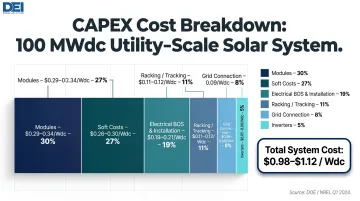
CAPEX breakdown for a 100 MWdc system (DOE/NREL Q1 2024):
- Modules: $0.30–0.36/Wdc (~30%)
- Inverters: $0.04–0.06/Wdc (~5%)
- Racking/Tracking: $0.10–0.14/Wdc (~11%)
- Electrical BOS & Installation: $0.18–0.24/Wdc (~19%)
- Grid Connection: $0.06–0.10/Wdc (~8%)
- Soft Costs (Permitting, EPC, Profit): $0.25–0.35/Wdc (~27%)
- Total: $0.98–1.12/Wdc
OPEX is relatively low due to minimal moving parts and no fuel costs. Annual O&M expenses typically range from $15–25/kW.
Financial Incentives and ROI
The Inflation Reduction Act (IRA) provides a 6% base ITC for projects 1 MW or larger, increasing to 30% when prevailing wage and apprenticeship requirements are met. Bonus adders include:
- +10% for domestic content (100% U.S. steel/iron, 40%+ manufactured products)
- +10% for energy communities (areas with closed coal facilities or high fossil fuel employment)
Projects also qualify for 5-year MACRS accelerated depreciation. Combined with the 30% ITC and current PPA pricing, most developers target equity payback within 6–10 years — faster in high-irradiance markets or energy community zones.
Strategic and Environmental Benefits
The financial case is compelling — but utility-scale solar also delivers measurable strategic and environmental value beyond the balance sheet:
- CO₂ displacement: At the EPA's marginal rate of 0.637 metric tons CO₂/MWh, a 100 MW plant running at 25% capacity factor (219,000 MWh/year) avoids approximately 140,000 metric tons of CO₂ annually.
- Job creation: The U.S. solar industry employed 280,119 workers in 2024, with the combined solar-and-storage workforce at 464,053.
- Grid resilience: When paired with battery storage, utility-scale solar reduces curtailment, supports frequency response, and cuts portfolio exposure to fossil fuel price swings — all without adding fuel risk.
Key Challenges in Utility-Scale Solar Projects
Land Use and Permitting Complexity
At 6–8 acres per MW, a 100 MW project requires 600–800 acres. Large land requirements create early-stage pressures on site control and community alignment. Regulatory timelines — especially interconnection queues averaging 55 months — significantly extend development schedules.
Agrivoltaics (dual-use solar and agriculture) offers one practical path forward. The U.S. now has over 600 agrivoltaic projects, with approximately 250 involving livestock grazing. Research indicates these dual-use systems result in 3.9% fewer emissions and 0.5% less energy demand compared to separate solar and farming operations.
Grid Integration and Curtailment Risk
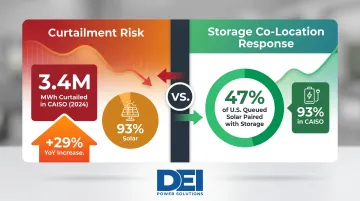
As solar penetration grows, midday oversupply and curtailment become significant concerns. In 2024, CAISO curtailed 3.4 million MWh of renewable output — a 29% increase from 2023. Solar accounted for 93% of curtailed energy. Curtailment peaks in spring when solar output is high and demand is low. Causes include transmission congestion, oversupply, and minimum natural gas generation requirements for NERC reliability compliance.
Battery storage co-location is the primary response. 47% of all active solar capacity in U.S. interconnection queues is now paired with storage; in CAISO, that share reaches 93%. Hybrid solar + storage systems shift generation to evening demand peaks, reducing curtailment exposure and improving revenue predictability.
Supply Chain, Equipment Compliance, and Execution Risk
Several procurement risks threaten project timelines on the execution side:
- Transformer lead times have reached 128 weeks, with specialized units taking 3–6 years
- EPC labor shortages compress scheduling windows, particularly during commissioning
- Module price volatility and international sourcing add cost uncertainty across procurement phases
- Switchgear and electrical equipment face extended delays when sourced through complex international supply chains
Sourcing from domestic manufacturers with in-house production capabilities directly addresses these delays. DEI Power, for example, manufactures UL 891-certified switchboards in Ontario, California, with 4–6 week lead times on custom configurations. Their BABA-compliant equipment simplifies procurement for federally funded projects and helps avoid the commissioning delays that non-compliant gear can trigger.
Future Trends Shaping Utility-Scale Solar
Technology and Storage Integration
Next-Generation PV
Perovskite-silicon tandem cells have achieved 34.85% efficiency in laboratory settings, exceeding the theoretical limits of conventional silicon. Commercial deployment is still in development, but higher energy density and lower land requirements are the expected payoff.
Hybrid Solar + Storage
EIA expects 18.2 GW of utility-scale battery storage additions in 2025, following a record 10.3 GW in 2024. Battery storage now accounts for 28% of planned 2026 capacity. The shift toward hybrid configurations reflects a straightforward reality: solar without storage faces curtailment risk and revenue limits in high-penetration markets.
AI-Driven SCADA
Advanced monitoring platforms now integrate predictive analytics and fault detection, cutting O&M costs and minimizing downtime. Some deployments already manage 200+ MW across multiple plants, with real-time performance data and automated alerts.
Market Growth Outlook
Those technology gains are landing in an already-expanding market. The IEA projects global annual renewable capacity additions rising from 683 GW in 2024 to nearly 890 GW by 2030, with solar PV and wind driving 96% of that growth. In the U.S., the pipeline is just as aggressive:
- 43.4 GW of utility-scale solar planned for 2026 alone
- Texas leads with 40% of planned capacity, followed by Arizona (6%), California (6%), and Michigan (5%)
- Utility-scale solar is projected to remain the dominant source of new U.S. generating capacity through the end of the decade
Frequently Asked Questions
What is a power system in electrical engineering?
A power system is the interconnected network of generation, transmission, and distribution components that produce, move, and deliver electrical energy from sources to end users. Utility-scale solar plants function as generation nodes within this network, feeding electricity into the transmission layer for broad distribution.
What are the main types of power systems?
Three primary types make up the grid:
- Generation systems — produce electricity (including utility-scale solar)
- Transmission systems — carry high-voltage power over long distances
- Distribution systems — deliver lower-voltage power to end users
Utility-scale solar plants connect to the transmission layer through on-site substations and step-up transformers.
What qualifies as utility-scale solar?
Utility-scale solar typically begins at 1 MWac minimum generating capacity, with electricity fed directly to the transmission grid rather than consumed on-site. State-level regulatory definitions may set higher thresholds — for example, North Carolina applies regulatory authority at 2 MW, and New York classifies facilities above 25 MWac as major renewable energy installations.
How long does it take to develop a utility-scale solar project?
Typical development timelines range from 12–36 months from site selection to commissioning. However, permitting and interconnection queue delays are the most common causes of schedule extensions — median interconnection wait times now exceed 55 months (4.5 years).
What are the main electrical components of a utility-scale solar farm?
Core components include:
- PV modules, combiner boxes, and central inverters (typically 1–3 MW each)
- Low-voltage switchgear, step-up transformers, and on-site substations
- SCADA monitoring systems for real-time performance visibility
UL 891-certified switchgear is required for low-voltage AC distribution between inverter output and step-up transformers.
What is the typical cost of utility-scale solar per kWh?
According to Lazard's 2025 LCOE+ report, unsubsidized utility-scale solar LCOE ranges from $38–78/MWh (average $58/MWh). That's down sharply over the past decade, making utility-scale solar one of the lowest-cost sources of new generation in the U.S.